Thank you for visiting and Welcome to excellent way to learn about Harmonic Trading and The Gartley trading pattern. This site will be updated regularly with further details on the Gartley trading, especially confirmation methods illustrated with detailed examples. Your valuable comments will be added here or taken for further discussions on the TradingArsenal Forum . Harmonic traders live trade examples and forcasts you may follow on Harmonics Tube. Hope together we can learn faster and discover more. Note that from the TradingArsenal site you may download a test version of our korHarmonics - harmonic and price patterns recognition indicator (MT4 only). It will, in real time, find your Gartleys, ABCD patterns and more. Is Gartley pattern true or a myth? Is the described in the books success ratio possible? How to choose from so many Gartleys found by the pattern recognition softwares? You will find the answers here...

Learn about the AMP project and TradingArsenal Forum for harmonic/market geometry traders -->TradingArenal

Learn about the TradingArsenal QUIZ project on quiz.tradingarsenal.com , beginner, intermediate and advanced level quizes are available for Gartley and the Butterfly pattern.

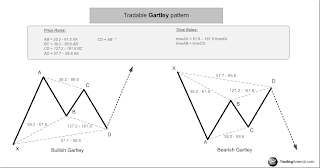
Gartley pattern definition and market position


Gartley 222 pattern

The Gartley 222 trading pattern was created by Harold M. Gartley, who first illustrated it in his book Profits in the Stock Market (1935). Gartley 222 pattern is reference to the page number on which the discussion about the pattern occurred.
Pages 200-250 of the book display majority of the market patterns ever described. It’s interesting to see how little the technical analysis changed over years.

Mr. Gartley describes the pattern as a retest of an important top or bottom, when market attempts to make a new high and low. It enables to enter in a high probability reversal zone with minimum risk.

Gartley pattern & Elliott Wave Theory

Pattern fits perfectly into Elliott Wave Theory. XA swing would be labeled as wave1 and ABCD would be labeled as ABC Elliott correction. Both harmonic and Elliott traders try to catch the strongest wave 3 or at minimum wave C.


Ideal Gartley pattern characteristic

Mr. Gartley draw the pattern and it’s market context/location. In the late 1980 In the book Profitable Patterns for Stock Trading Larry Pesavento assigned certain ratios to define the pattern precisely. He measured each price swing from peak to trough as a certain percentatge of the proceding price swing. Pesavento required these percentages to be Fibonacci ratios: 61.8, 78.6 100, 1.27, 1.618.


Tradeable Gartley pattern characteristic

Problem is that it’s quite rare to see the Gartley pattern with exact precise Pesavento’s Fibonacci ratios. Some % delta or Fibo ranges must be used to expand the acceptable price swings ratios and produce more patterns, more trading opportunities. For example to allow XD retracement to be 57.7 till 88.6 rather than exactly 78.6.
What important is that AB=CD (later on you will read about my definition of the equality here).

Continuation and Reversal Gartley position

H. M.Gartley defined only 1 proper market position for his pattern – at critical trend reversal point. Pesavento’s “Gartley” (ideal version) or extended “Gartley” happens of course more often and in different market conditions. One of the scenario important from the trading perspective is when the pattern is forming inside wave3. Wave3 inside wave3 is the strongest and most powerful market structure.

We can also observe “Gartley” inside corrections periods when the swing following the pattern would be much smaller.

The point is that we can trade Gartleys (with original reversal position defined more than 70 years ago) and “Gartleys” (meeting Fibonacci equations) forming as trend continuation patterns.


Let's spot Gartley pattern

Enough teory for now. What at the end counts is that we look here at probably most powerfull and profitable price pattern forming on the charts. When you see its first 3 legs completed and forming swing CD crossing the point B price level - GET READY. Now your work starts.


Mare sure you check also:
Construct PRZ (Potential Reversal Zone) for the Gartley pattern
Gartley pattern confirmation methods - trendlines
Gartley pattern confirmation methods - divergences
Gartley pattern confirmation methods - combining timeframes
Gartley pattern confirmation methods - reversal candlestick patterns
Gartley pattern confirmation methods - AB ?= CD
Gartley pattern confirmation methods - volatility
Gartley pattern confirmation methods - cycles
Gartley pattern 70-80 success ratio
Gartley pattern failure setups
Confirmation methods - more to come...

Read more...

Construct PRZ (Potential Reversal Zone) for the Gartley pattern


Fibonacci Measurements methods


There are 4 types of common Fibonacci measurements in harmonic trading.

Internal price retracements

Internal Retracements are retracements of less than 100%. This can be seen as a correction to the prior trend. Most common ratios for internal retracements - 38.2, 50, 61.8, 78.6%.

External price retracements

An external retracement, since it is greater than 100% of the swing that is retraced, can be seen as part of new trend. Most common ratios for external retracements – 127, 161.8%.


Price extensions

Price Extensions expand the price swing by a chosen ratio. Most frequent use of price expansions are expansions of wave1 in Elliott Wave Theory to predict the end of the wave3, but can be used in any other case as well. Most common ratios for price extensions – 61.8, 100, 161.8, 200, 261.8%

Price projections (APP)

Price Projections (also called APP-alternative price projections) are measurements which compare swings in the same direction. They project trend swings with trend swings and corrections with corrections. We simply take low to high swing and project it from different point on the chart.
Most common ratios for projections – 61.8, 100, 161.8, 200%

Fibonacci cluster, confluence, convergence or Potential Reversal Zone


Using combination of retracements, projections and extensions we can build a Fibonacci cluster also referred as Fibonacci confluence, convergence or Potential Reversal Zone. Closer and more lines from different measurements stronger PRZ, meaning higher probability it will work as support or resistance level and will allow a trader to enter into low risk and high probability trade.

In practice we look for minimum 2 Fibonacci price relationships coming together with a relatively tight range. When a price enters the PRZ we expect that this area will stop the prior market move and act as Support or Resistance. We observe the price behavior at this level, a trigger that will tell us to enter the market.

Similar to Fibonacci price measurements we work on Fibonacci time measurements. Time clustering will allow us to identify time when the price hit the support/resistance level and retrace.

Fibonacci measurements and creation of the price and time clusters deserve a separate blog post.


Trading would be too easy if by placing retracement, projection and expansion on the chart we would see them all clustering on 1 PRZ. No. Usually you will get number of clusters, number of potential levels where price will stop and retrace. How to choose the right one? … hm, that is why you have other confirmation techniques.

Note that very often in a books or articles you can see charts with marked PRZ, presenting just couple of lines, all meeting in very tight price level. Keep in mind that all the other lines were removed and chart most often prepared post factum. Picture below presents all measurements while looking for the potential Gartley pattern. The one where price turned was one of the candidates, but not the only one where clusters were visible.
Note also that after sometime working with the method you will discover that some out of 4 measurements types are less reliable than the others. You will also decrease number of Fibonacci ratios you apply. Simplification comes with time.


Read more...

Gartley pattern 70-80% success ratio


Most of the information that I've found over the internet regarding the Gartley pattern suggests a success ratio of 60 to 80% (70% the most common). My personal opinion is that it is not proper to state any success percentage without specifying applied money management rules, instruments traded, timeframes of the trades, tested period, trading experience and applied confirmation methods. Clearly, with 2:1 RR you may reach your Take Profit level more often than you would with 3:1 RR and therefore success ratio percentage itself is useless.

During my first years trading the pattern appeared to have a success ratio of no more than 60% and because of weak money MM I was losing with it. It all looked nice on Carney's and Pesavento's books, but I found that it was quite a different story on the charts. To locate a reasonable pattern on the chart was a challenge and to open a position in an optimal place was short of a miracle. This is one of the many reasons why korHarmonics was created (I'll write more on the other reasons on a later blog).
With more experience, I started to look at the Gartley pattern from a different view point. The market context/pattern position became more important than the Fibonacci relationships (for example the equality of AB and CD swings). I figured out the the differences between Mr. H.M. Gartley's pattern and Pesvento's "Gartley" version (with the specific Fibonacci measurements).

I enlarged my arsenal of confirmations, learned about 12345s and the ABCs of Elliott Wave, and started to apply market cycles, trendlines, and price actions elements. My Gartleys started to work and still are the best price patterns I know and use today. I aim for 3:1 Reward Risk ratio, but sometimes settle for 2:1 and call it a day. It is not uncommon for the Gartley pattern to offer 5:1 and even 10:1 and better ratios, but I rarely go for it, as "Just take the money from the market" is what my mentor keeps telling me and I've learned that you'll never go broke taking profits.

I now combine the harmonic trader eyes with an Elliottican's perspective. For Elliott Wave traders, Gartley gives us an opportunity to enter at the beginning of wave 3 or at least C, for harmonic traders it is the most known and most powerful harmonic pattern. For people using cycles, oscillators, divergences, trend lines, price action with support/resistance and Fibonacci levels, for the majority, if not all of them, Gartley patterns will meet their system's conditions. Due to this major confluence of trading systems/methods, Gartley offers a very strong move and because of market position and small risk involved, it is a highly profitable setup.
Even in scenarios when the patterns fail, you observe an initial market reaction at point D in your favor.


After including several confirmations described here and with time spent on the charts, you will reach the promised 70-80% success ratio (while always using reasonable MM). Note that if you add more confirmations your success ratio will increase but along with that your potential trades will decrease substantially. Thankfully there is never a lack of these patterns as they are present on all timeframes and instruments regularly.


The diagram below presents the equity curve for a system with a 70% success ratio and 3:1 Reward:Risk.


Use the tool  below (available also from http://hquotes.com/) to check our potential equity curves if our success ratio falls to 60%. Play around with the parameters to experience how little success ratio is needed if we keep our 3:1 Reward:Risk ratio. 50% and 2:1 isn't bad either is it? Bottomline is, you can be right less than 70% and still get paid nicely?


Note that I am using the MT4 platform, and while I do find it very good for developing and testing automats in real-time mode, it is poor for historical testing due to the limited data offered, low performance, and memory consumption.


I would like to offer you a detailed historic test but the MT4 limitations hinder me from doing this. I will soon be better acquainting myself with AmiBroker to have better access to backtesting tools.


Mare sure you check also:
Gartley pattern definition and market position
Construct PRZ (Potential Reversal Zone) for the Gartley pattern
Gartley pattern confirmation methods - trendlines
Gartley pattern confirmation methods - divergences
Gartley pattern confirmation methods - combining timeframes
Gartley pattern confirmation methods - reversal candlestick patterns
Gartley pattern confirmation methods - AB ?= CD
Gartley pattern confirmation methods - volatility
Gartley pattern confirmation methods - cycles
Gartley pattern failure setups
Confirmation methods - more to come...

Read more...

Gartley pattern failure setups


Sometimes when you are stopped out just by couple of pips you start thinking if placing your StopLoss for Gartley pattern at X point level is really smart way. Yes, you should be thinking on it.


Another example of failing harmonic Gartley pattern. Common scenario. 
Minimum point B price level was reached, but this is not what we usually expect when trading Gartley. We count for strong impuls (Elliott wave 3) to follow.
Here after reaching point B market continued to drop:


Read more...

AMPmonitor - automatic harmonic pattern recognition


AMPMonitor is a powerful web based platform that scans and alerts you on the price patterns and harmonic trading opportunities: Gartley, Bat, Butterfly, Crab, 3Drives, Shark, 121 pattern. AMPMonitor is built on AMP indicator engine. It searches for the most symmetrical and strongest setups, and then applies proprietary confirmation techniques and filters leaving you with a list of patterns which have the highest probability of success. 

We believe that there has not been such an advanced and user friendly software platform to search for harmonic patterns in the market until now.


See some examples below:


Read more...

Gartley trade examples


Read more...


more to come ...
- correlations
- pitchfork confirmations
- volume confirmation
- failure patterns
- entry and exit strategies
- pattern recognition
... and more

Visit:
http://www.tradingarsenal.com/ for more info on our developments
http://harmonicstube.blogspot.com/ for harmonic based forcasts and real live trade examples
For AMP indicator info check AMP indicator info and here AMPmonitor for iPhone info check AMPmonitor for iPhone Read more...